Hello Everyone,
What really drove NIFTY 50 in 2025 — a 10.05% annual gain, new ATH, and a 17.4% drawdown?
This heatmap-based analysis visually breaks down index weightage, sector strength, and hidden trends every investor should understand.
Are you looking for any below ?
Why this matters for investors:
- SIP investors tracking index drawdowns Helps investors avoid buying at peaks or averaging blindly during drawdowns – Understand previous year drawdowns and invest accordingly
- Heatmaps reveal market correction in the past years on same month
- Understand the Nifty stocks and sector weightages
- Long-term NIFTY & ETF Investors should track the heatmap – shows that past 10 years returns are on the positive side.
Nifty 50 is the benchmark index of the Indian stock market. Here’s an heatmap overview of its performance and weightage distribution:
Explore the latest NIFTY 50 Index Companies and its weightage & Sensex 30 Companies and its Index weightage
Read the previous year Returns Commentary here.
Performance Highlights: Past Returns (2025)
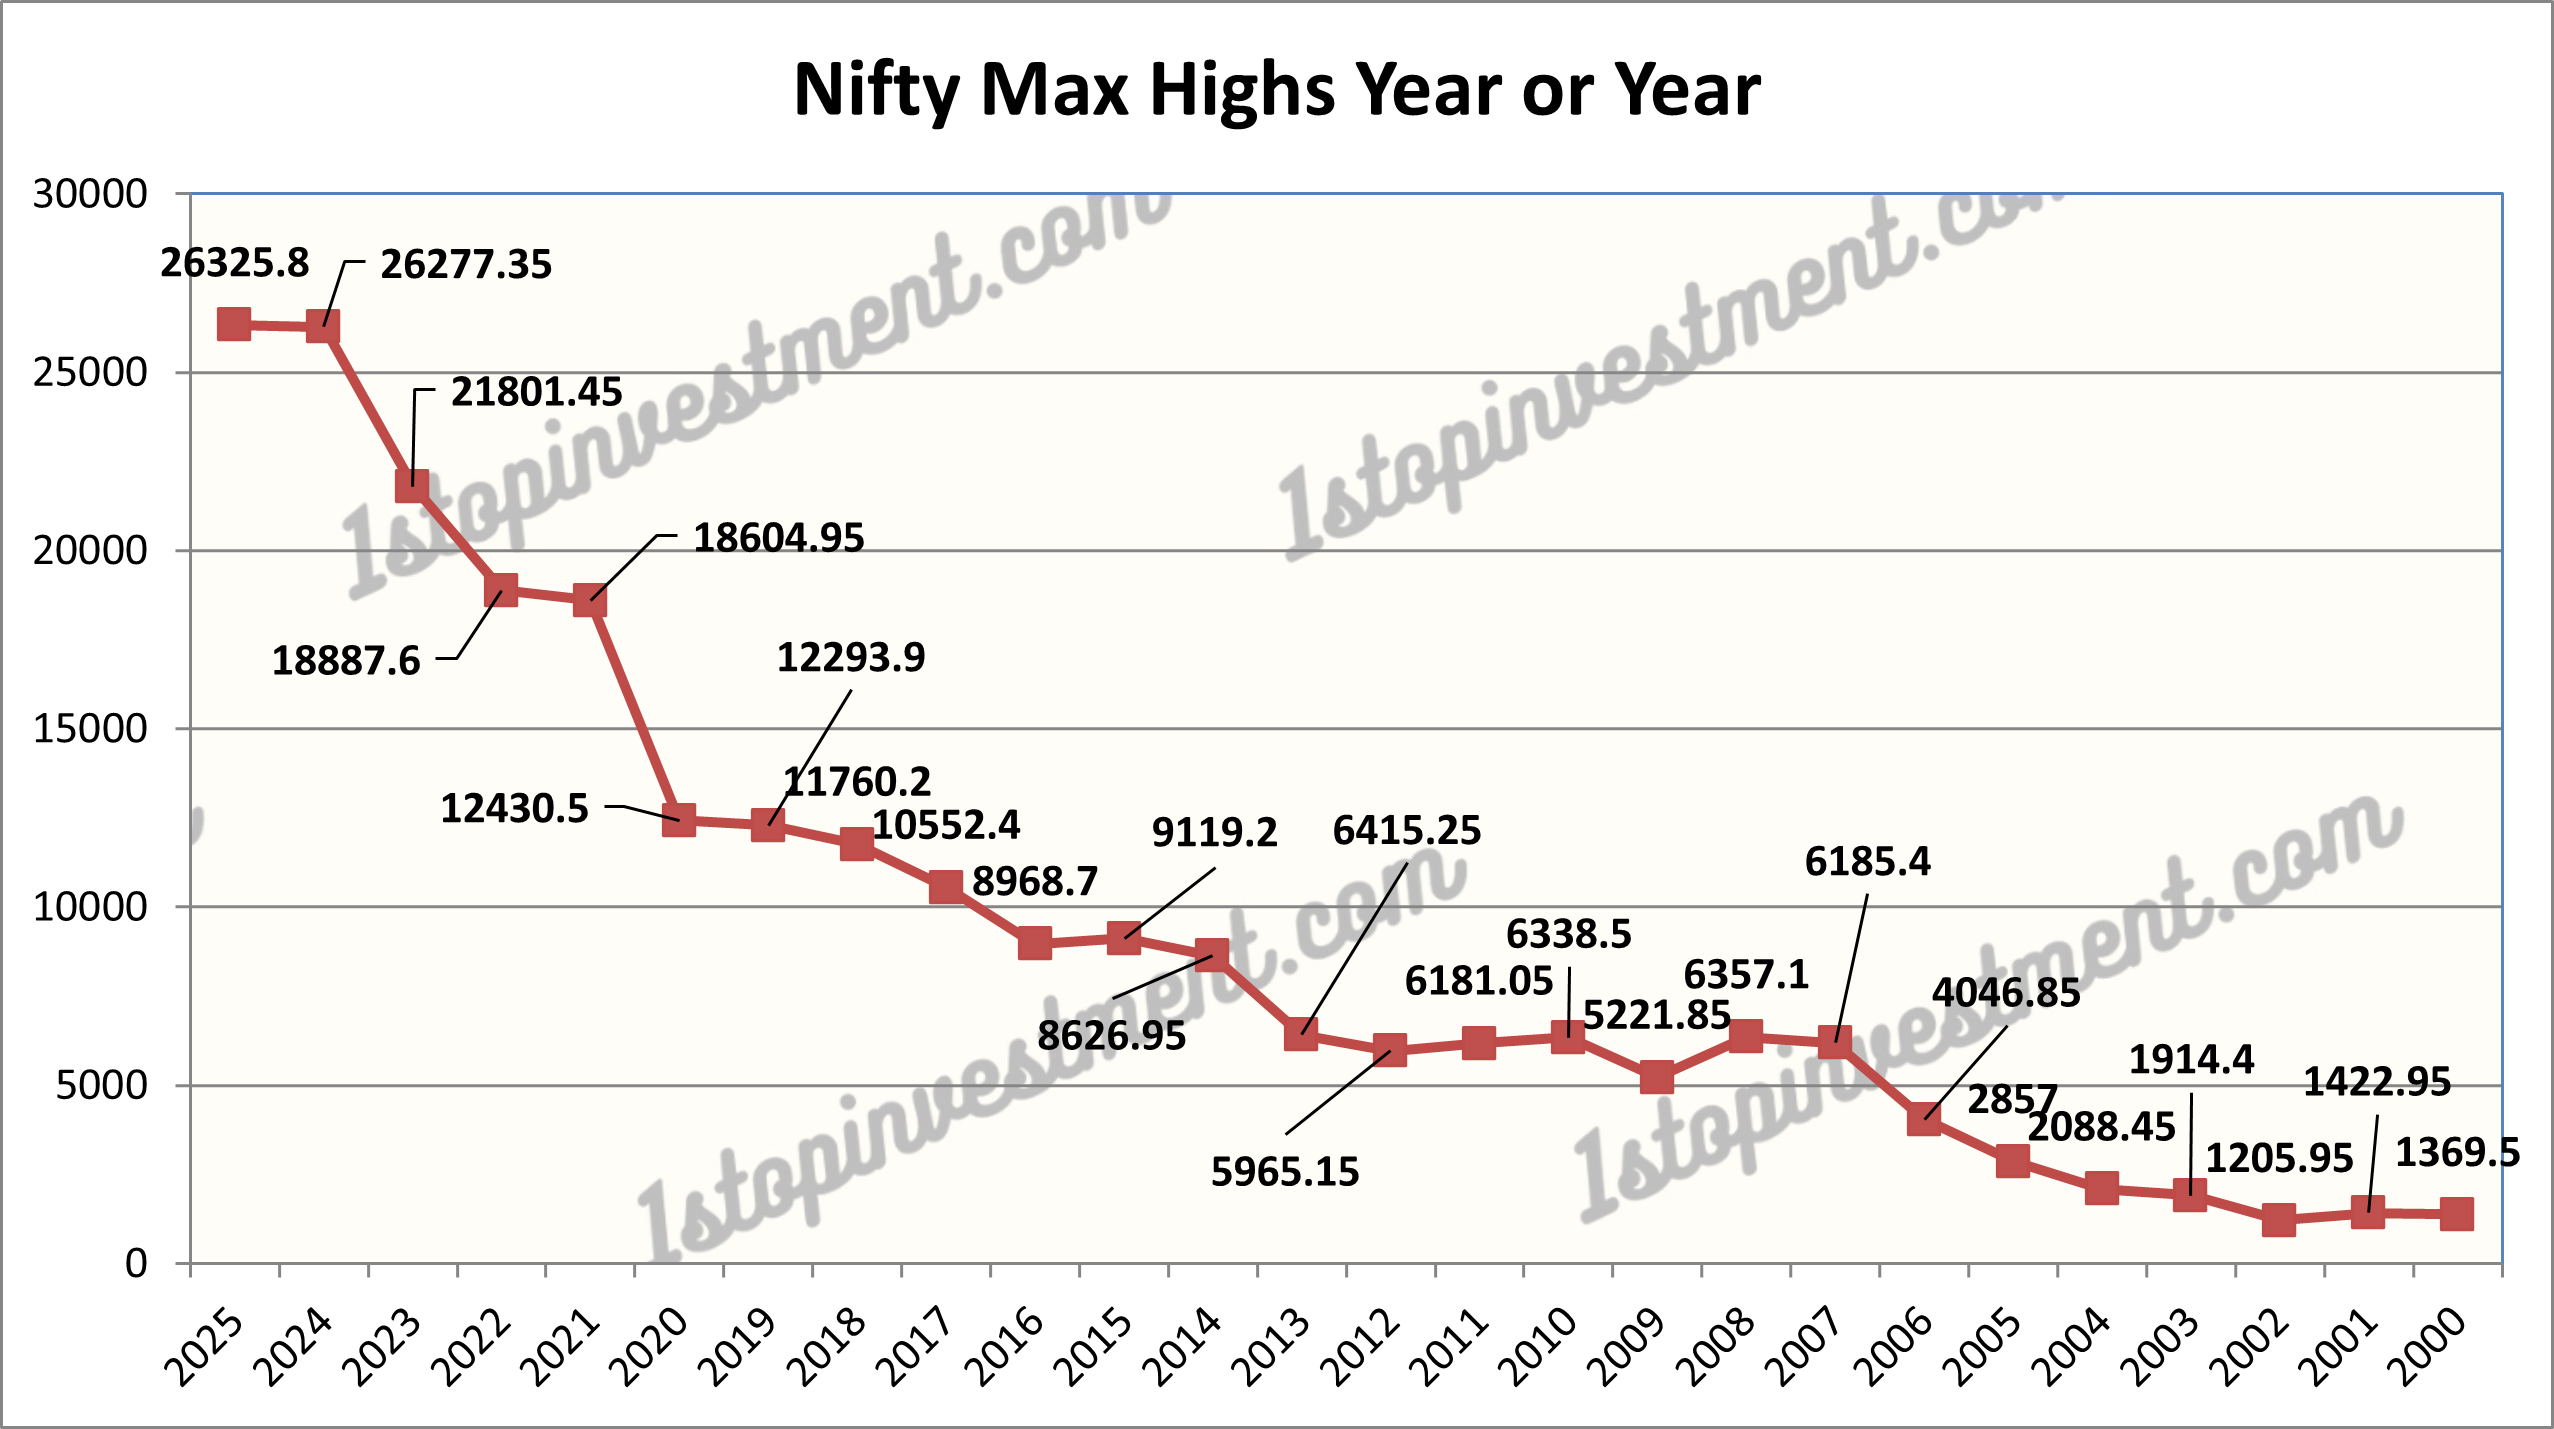
- All-Time High (ATH): Nifty50 reached 26,325.8 in December.
- Best Monthly Return: March 2025 recorded an impressive +6.33% gain.
- Annual Performance: Yearly gain: 10.05% (Ranked 20nd out of 35 years since 1990).
Check out the Nifty Monthly Returns Heatmap to understand the trends.
The following heatmaps convert complex market data into a simple visual format — green highlights leadership, red signals stress, and size reflects real index influence.

See the Current year drawdown – 17.4% which is much closer to the previous year.(20%)
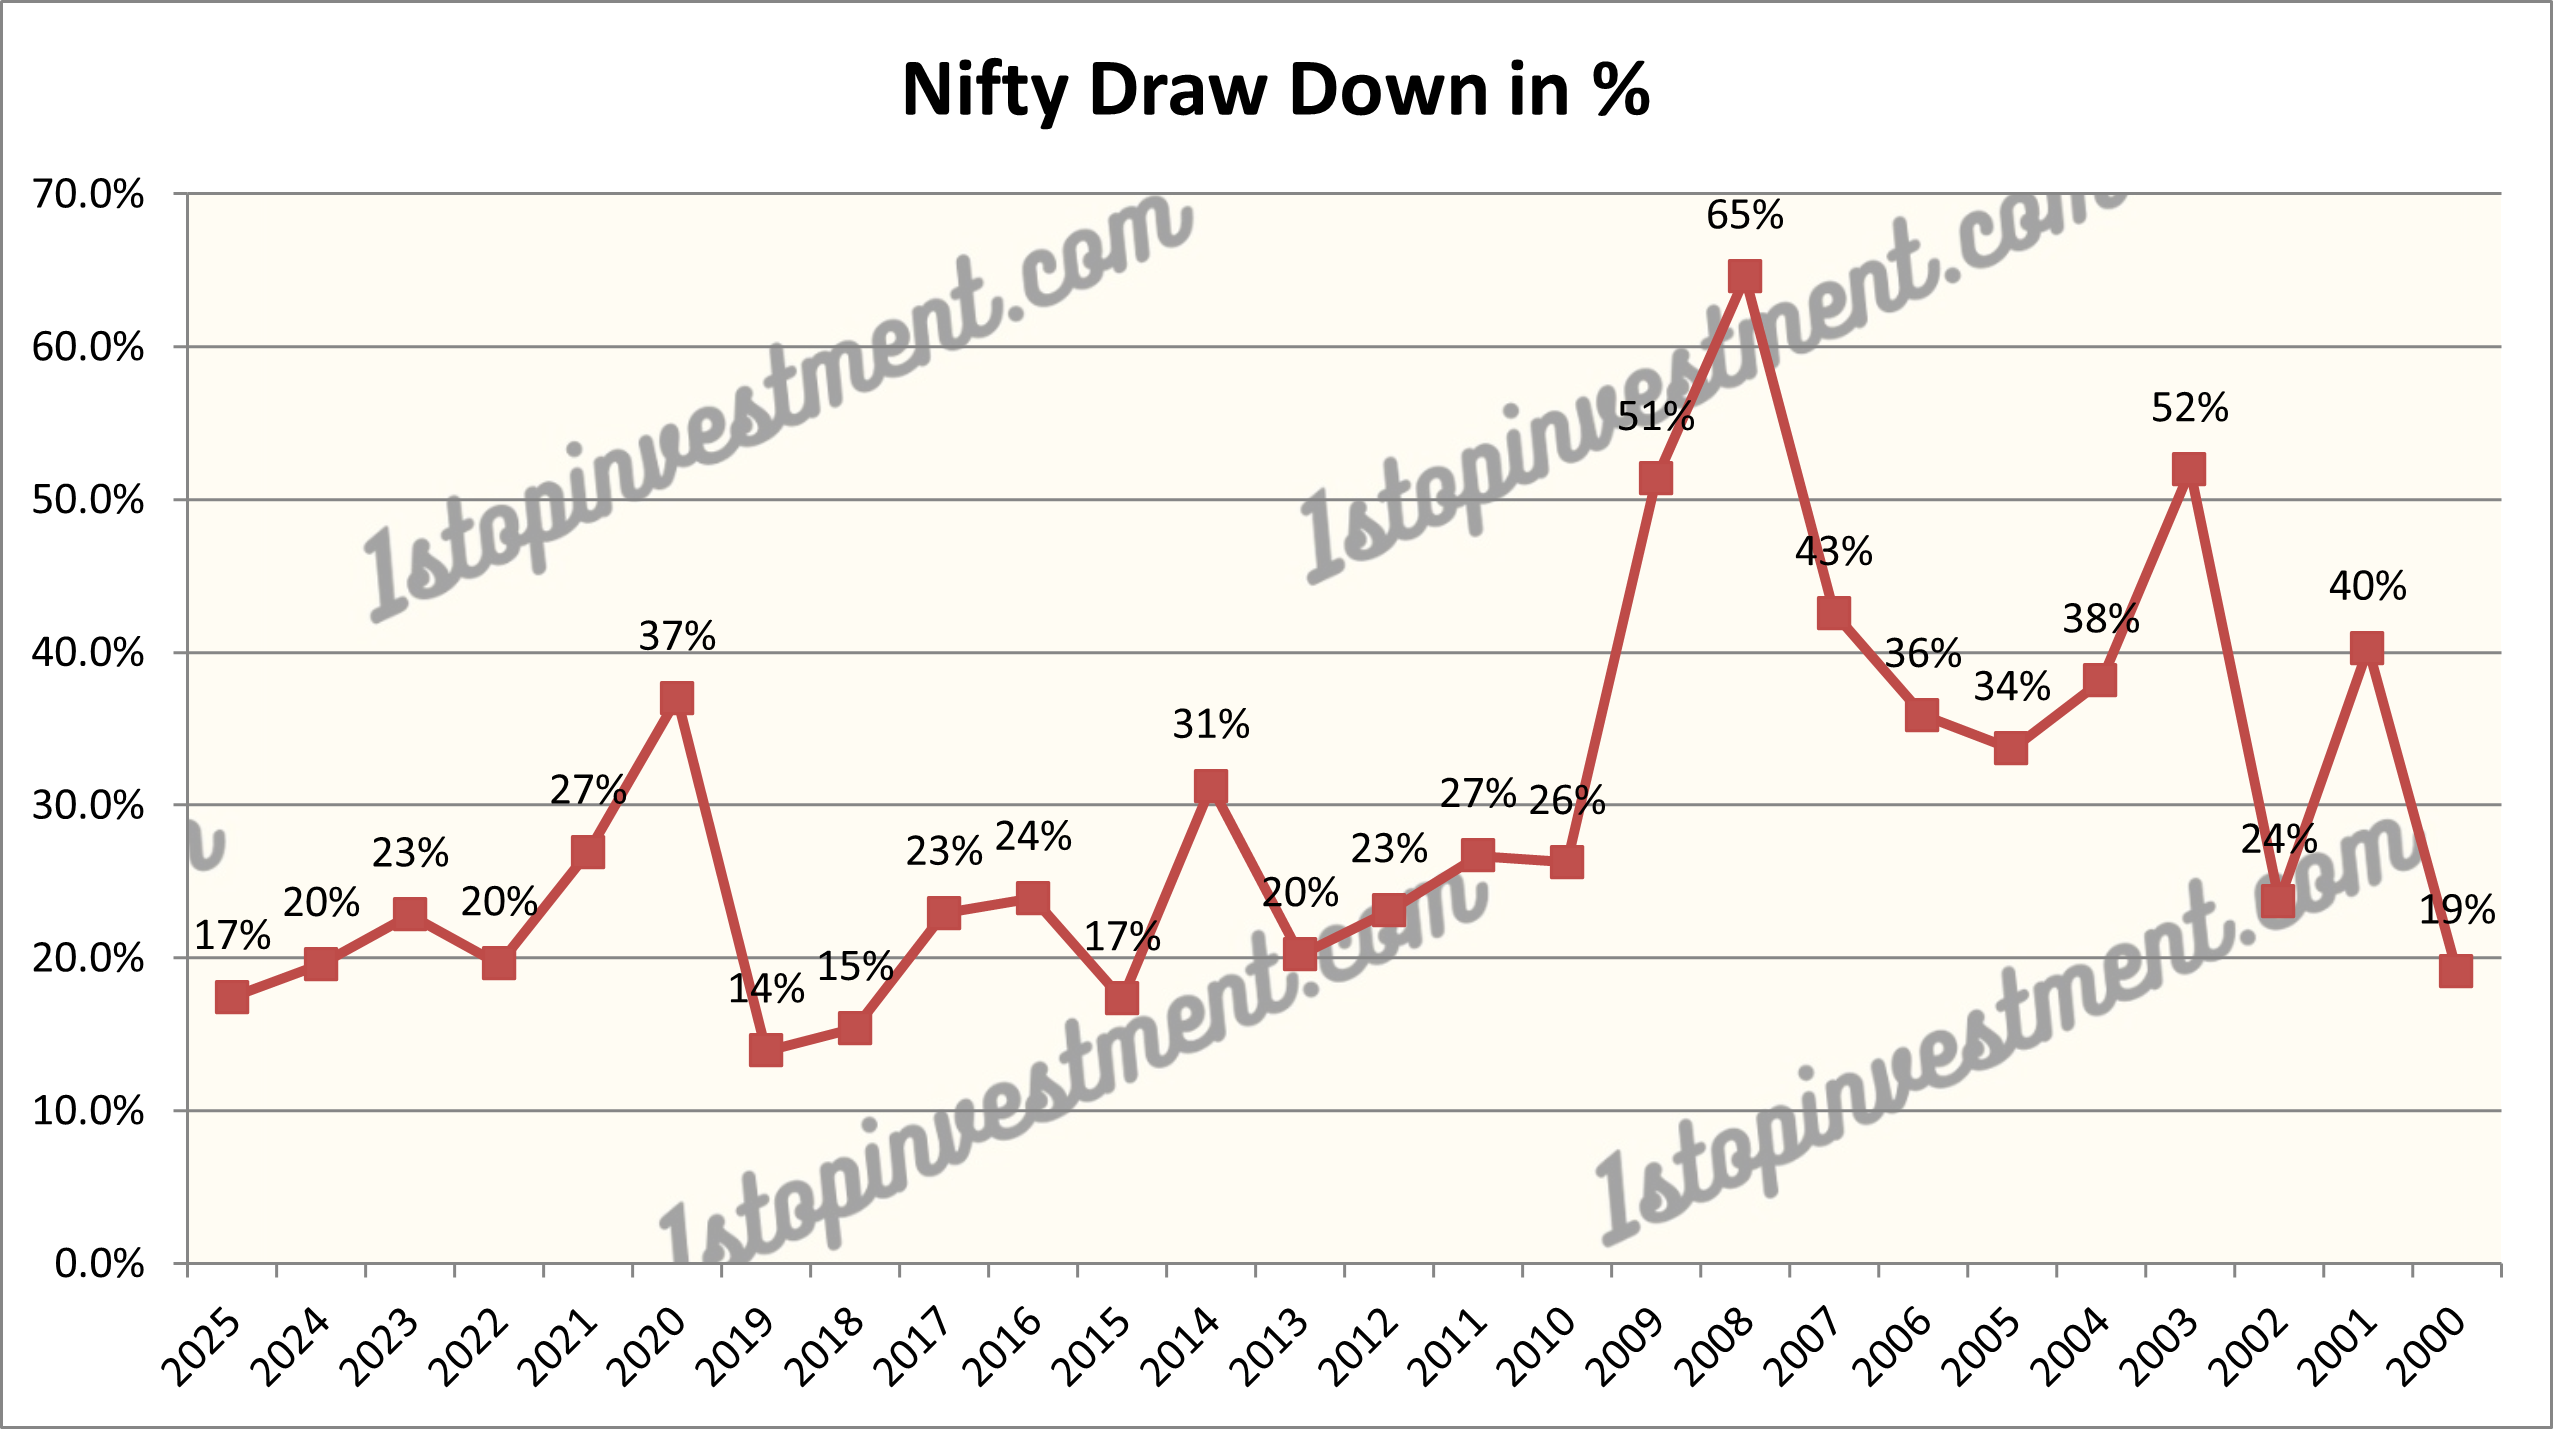
Read more about drawdown here → Nifty , Sector Indices; Stocks Drawdown Meter; Know this before you buy or Averaging the stocks
For the comparision between Nifty and Crude for the Past 34 year, Check out the below Graph.
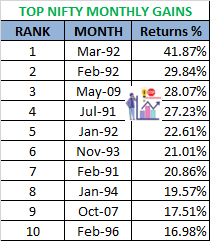
TOP 10 NIFTY Monthly Gain (HISTORIC)
TOP 10 NIFTY Monthly Fall (HISTORIC)

Finally, In index investing, knowing where returns come from is as important as knowing how much returns you made.
Tools & Resources
The same heatmap patterns seen in previous cycles often appeared before major market shifts — understanding them early can change decision-making.
Exclusive Offer for Enthusiasts:
- Purchase & Download customizable the above Nifty 50 heatmap Excel sheet template for your own other analysis.
- Write to us specific sheets at an affordable price. ⇒ mailto1stopinvestment@gmail.com
Thanks for reading & Contact us if you have any other queries.
You shall download the Stock market related Excel Templates here and Request for other specific sheets at low cost to our email.
We are now on Telegram also! Get our latest views and daily updates on stock markets and many more. Join our Telegram channel here & LIKE OUR FACEBOOK PAGE.