Hello Investors,
In times when stocks are bleeding to survive in this fall, it is healthier to remember the dividend yield formula.
Dividend yield (%)= Dividend per share / Current Market Price.
By looking at the Dividend yield, We all will be tempted to buy the stocks right away.
Does it mean the company performs well and provides Investors good returns.? It is not, Why?
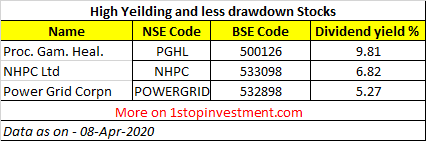
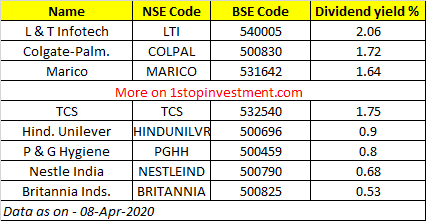
A falling stock can also make the dividend yield looks great. See below high Dividend Yeild stocks.
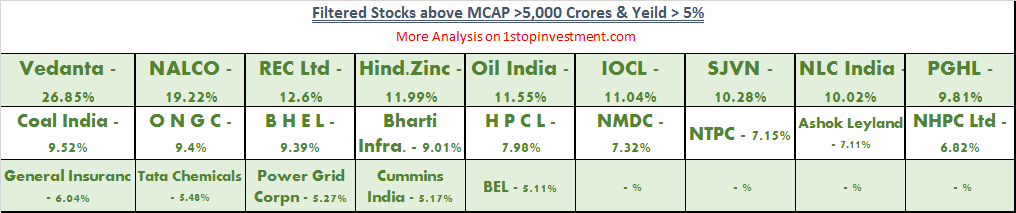
But It is from the Past dividend data and when you look at their Drawdown ratio, it is making us more worry.
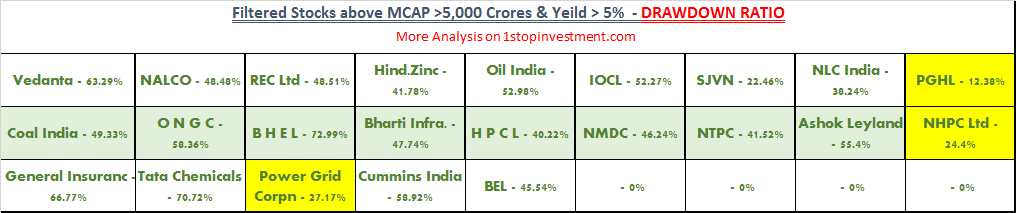
Only 3 Stocks are with less drawdown and greater than 5% dividend.
So , We will have to see the above dividend yield formula in two perspectives as a PROs.
Dividend yield (%)= Dividend per share / Current Market Price. (New-Investor)
&
Dividend yield (%)= Dividend per share / Purchased Price. (Already-Invested)
How looking at Dividend Yield alone works against you?
When you look at any website, it will show the dividend yield in % with respect to CMP.
- The Dividend announced by the company is Fixed.
- But the Dividend yield varies every day with the CMP.
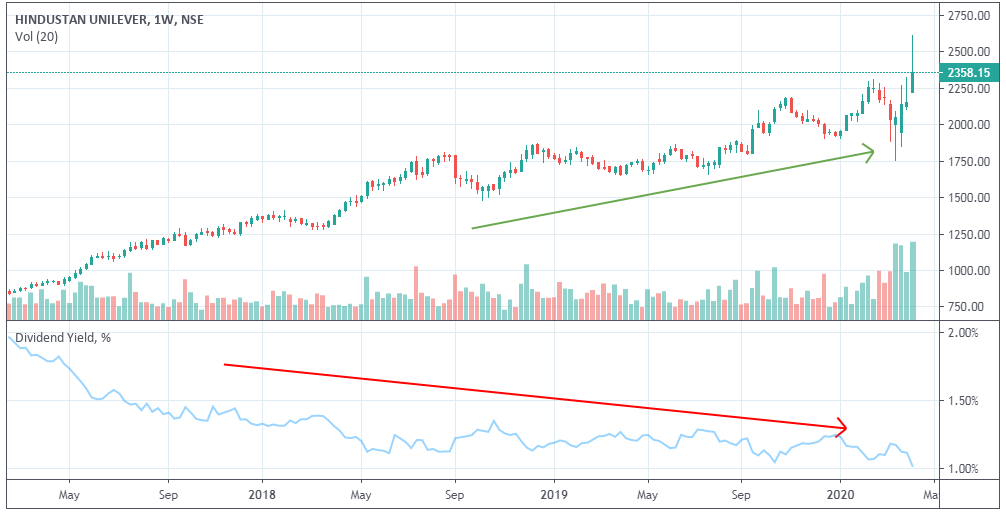
If the stock price is falling, the Dividend yield increases See the Example below.
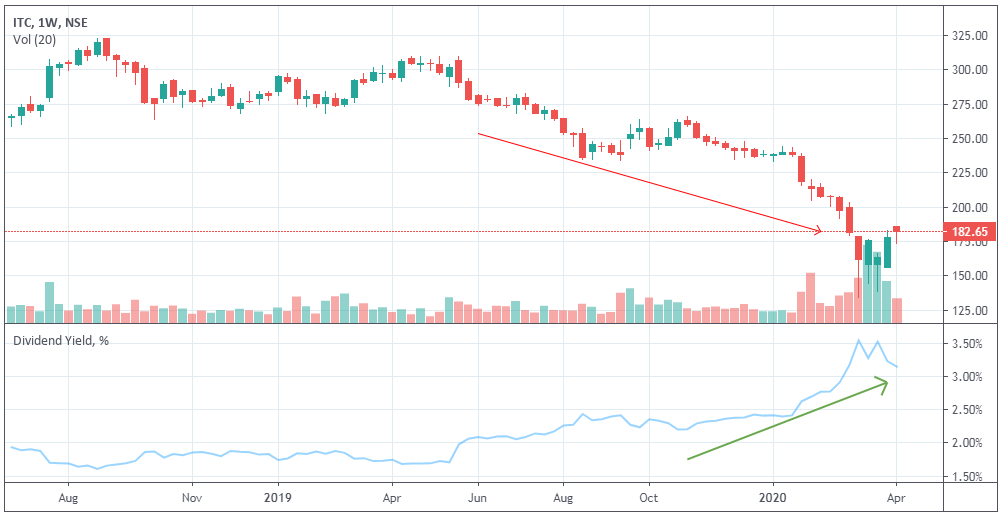
Vice-versa happens , when the stock is rising.
Remember this, “All high dividend yield stocks are not a good buy – Buy only fundamentally strong companies”
Factors to consider select good dividend stocks?
- High Market Capitalization – MCAP
- Zero to Low DEBT Companies – Debt to Equity Ratio
- High (Employed Capital to Total Expenses) ratio – EC/TE Ratio
- High Net growth
- Check the Drawdown ratio – Least drawdown stocks are strong.
- Finally Comes the “DIVIDEND YEILD” Ratio
Read more about drawdown ratio here.
Sample Selection Process :
There are 3060 Stocks trading in the Indian Stock Market as per BHAVCOPY report.
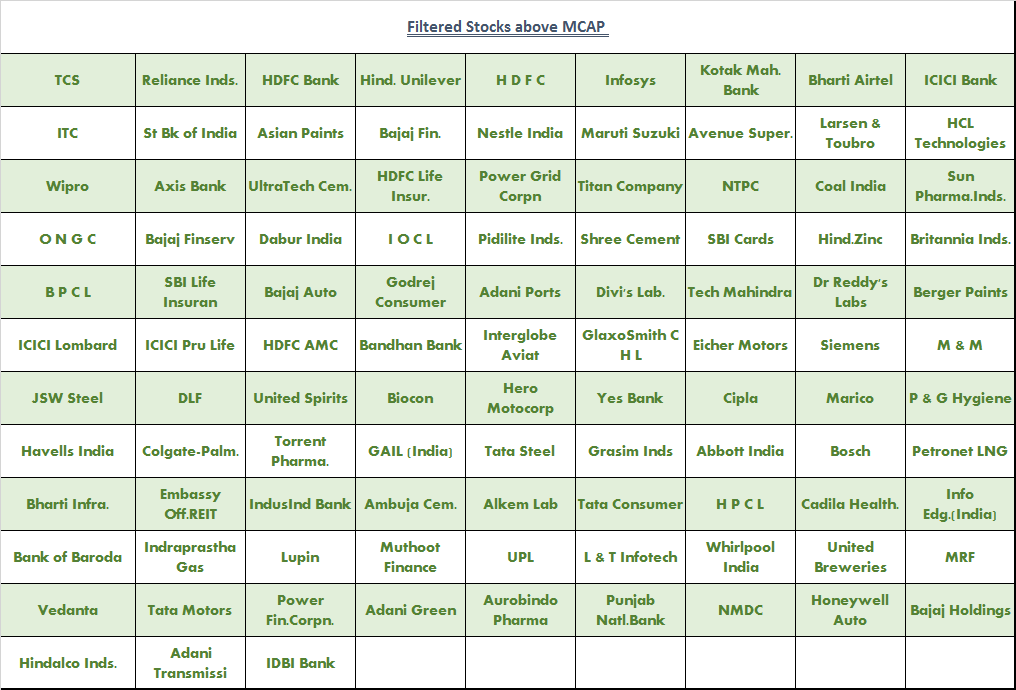
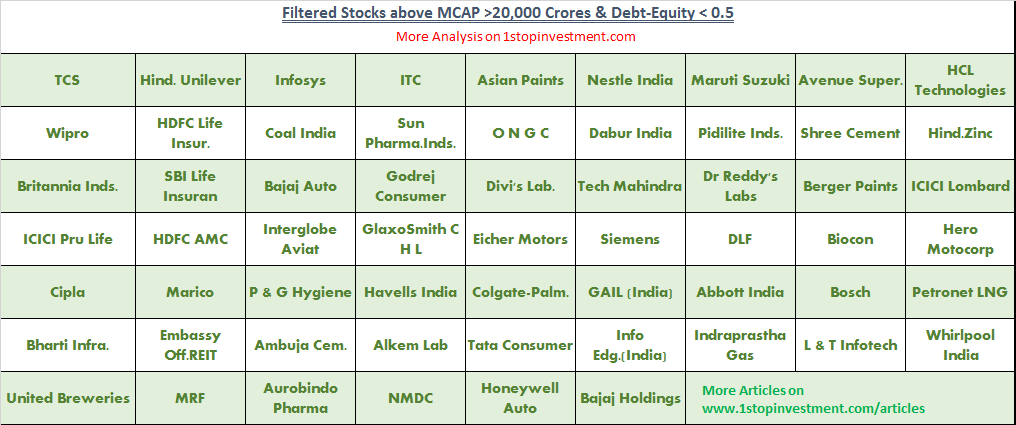
1. High MCAP
- Greater than 20,000 Crores – 102 Companies
- Greater than 10,000 Crores – 177 Companies
- More than 5,000 Crores – 267 Companies
I choose the first with 20,000 Crores – 102 Companies.
2. Low Debt to Equity Ratio D/E
Out of 102, Only 19 companies have Zero Debt. So Kept D/E ratio less than 0.5 – 60 Stocks
When you are choosing high MCAP, you can not choose Zero Debt Companies alone.
3. Return on Capital Employed
- Greater than 20% – 40 Companies
- Greater than 30% – 22 Companies
- More than 40% – 11 Companies
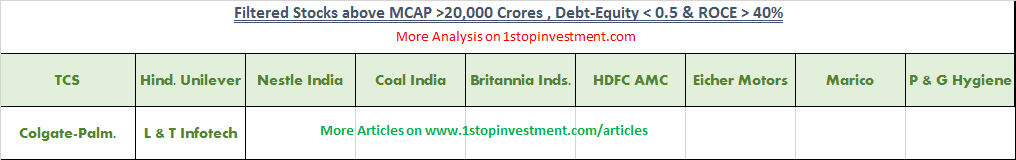
ROCE – I used 40% because, Once the growth is defined, the company will pay a hefty dividend and meanwhile, stock price also increase.
4. Draw-down Ratio :
Benchmark I used in NIFTY and Stocks above the benchmark Drawdown. Only 9 Stocks are left.

5. Dividend Yield Check :
Invest as per your risk profile.
Hope it helps in selecting the stocks.
Happy Investing!
Share with your friends if you like the process.
Disclaimer: None of my articles, products, stock list etc should not be treated as an investment advice. All types of content provided here are the bloggers personal views. It should not be considered as financial advice. You should consult with your own financial advisor before using any information provided here.